


Bellfield Junior School
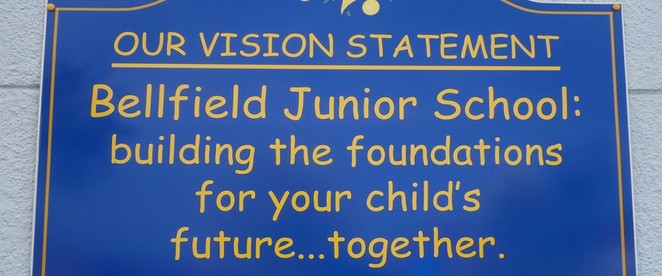
‘Building the foundations for your child's future - together'
- Home
- Our aims & ethos
- Term Dates
- Virtual Office
- Statutory Info
- Our Curriculum
- Children
- Parents
- Governors
- Friends of Bellfield
- Our Community Work
- Special Events
- Year 3
- Year 4
- Year 5
- Year 6
- Indonesia Link
- Commonwealth Games 2022
- Merritts Brook Field- info & booking


Key Stage 2 Results 2017
Important links related to Key Stage 2 SATs 2017: click on the image to open the links.
 Info for parents
![]()
SATs results information from DfE
Key Stage 2 SATs in 2017: How well did we do?
This report is downloadable HERE
Year 6 pupils have to take compulsory SATs (Statutory Assessment Tests) in May of each year. This report explains the outcomes of the Year6 SATs tests from May 2017.
Year 6 pupils worked extremely hard. The tests are made up as follows:
English: 1 x 1hour reading test; 1 x 45 minute EGPS test and one spelling test (not timed).
Writing: teacher assessed based on evidence from a selection of writing – the school also used an outside moderator to check teacher judgments.
Maths: 3 x 45 minute tests (1 arithmetic and 2 reasoning /problem solving tests)
The tests do not give levels as in previous years (pre 2016) – they state whether children ‘achieved expected levels’, were below ‘expected levels’ or were ‘working at greater depth’ (higher than expected levels).
Although our results of Reading, Writing and Maths combined is lower than in previous years, this was a year group that came into BJS at a significantly lower level than the Natioanl average and had significant issues regarding behavior and emotional health. The school had worked very hard to support these children. It is interesting to note that many children were only 1 or 2 marks off achieving the ‘expected’ levels.
Our ASP (Assessing School Performance) – the information the DfE publishes to show how well our children are doing – showed that although our attainment was below average compared to National figures, our progress indicators show that children are making at least good progress – inline with National averages. Compared to similar schools to ourselves, our progress indicators are favourable.
We would like to say that we only achieve these results with parental and family support and we would like to say a big thank you to all of the families who support us and their children – without this being a team effort, we would not have the progress and success that our children achieve.
Our priorities since 2016/17 are to improve the attainment of EGPS and writing by adapting our curriculum and creating ‘learning journeys’. This began in Sept 2016 and we have had support from external consultants and moderators – this is seeing good success. Our main priority for 2017/18 and 2108/19 is maths ‘mastery’, ‘the Love of Learning’ and ‘Philosophy for Children’ – ensuring our children leave Bellfield Junior School resilient, enjoying their learning and ambitious for the next stages of their learning journeys.
May 2017 Year 6 SATs Data: Context of cohort who took the test:
53 children; 27 girls/ 26 boys. 45 disadvantaged (78%). 18 children (32%) SEND, inc 1 EHCP (who did not take the test). EAL children = 5 (11%)
3 children have no KS1 data. (which means their scores cannot be used to show progress from KS1-KS2)
KS1 ave score: 14.6 (-1.0 national – significantly below the National average)
This year group had 32 (57%) of children classed as ‘vulnerable’ due to a variety of issues, some extreme.
ALL DATA IS CURRENTLY ‘UNVALIDATED’-this means the Government has yet to confirm the figures for the school and this means figures could rise by up to 4% (attainment) and by up to +0.5 (progress) in each subject. Validated data should be available by the end of 2017, according to the Government.
%age reaching expected standard+ (scaled 100+)
|
|
all |
boys |
girls |
|||
|
|
national |
school |
national |
school |
national |
school |
|
Rdg, wr, ma com |
61 |
35 |
57 |
35 |
65 |
35 |
|
Reading |
71 |
56 |
68 |
54 |
75 |
59 |
|
Writing (TA) |
76 |
60 |
70 |
54 |
83 |
66 |
|
Mathematics |
75 |
46 |
75 |
46 |
75 |
45 |
|
EGPS |
77 |
61 |
73 |
61 |
81 |
61 |
%age reaching a high standard or working at greater depth (scaled 110+)
|
|
all |
boys |
girls |
|||
|
|
national |
school |
national |
school |
national |
school |
|
Rdg, wr, ma com |
9 |
4 |
7 |
4 |
10 |
3 |
|
Reading |
25 |
12 |
21 |
7 |
28 |
17 |
|
Writing (TA) |
18 |
7 |
13 |
4 |
23 |
10 |
|
Mathematics |
23 |
11 |
24 |
11 |
21 |
10 |
|
EGPS |
31 |
16 |
n/a |
n/a |
n/a |
n/a |
Average scaled scores: (100.0 is the min expected average)
|
|
national |
School |
|
Reading |
104.1 |
100.6 |
|
EGPS |
106 |
n/a |
|
Maths |
104.2 |
99.9 |
This table shows the progress indicators: National Average is 0.0, so + is above National and – is below National.
|
Reading |
Writing |
Mathematics |
|
|
-0.39 2 |
-0.01 3 |
-1.4 1 |
|
1 This means that our progress was at National average for Mathematics, meaning we were in line with approx. 60% of schools Nationally
2 This means that our progress was at National average for Reading, meaning we were in line with approx. 60% of schools Nationally
3 This means that our progress was at National average for Writing, meaning we were in line with approx. 60% of schools Nationally


school website, mobile app and podcasts are created using School Jotter, a Webanywhere product. [Administer Site]
Our use of cookies
We use necessary cookies to make our site work. We'd also like to set optional analytics cookies to help us improve it. We won't set optional cookies unless you enable them. Using this tool will set a cookie on your device to remember your preferences.
For more detailed information about the cookies we use, see our Cookies page
Necessary cookies
Necessary cookies enable core functionality such as security, network management, and accessibility. You may disable these by changing your browser settings, but this may affect how the website functions.