


Bellfield Junior School
‘Building the foundations for your child's future - together'
- Home
- Our aims & ethos
- Term Dates
- Virtual Office
- Statutory Info
- Our Curriculum
- Children
- Parents
- Governors
- Friends of Bellfield
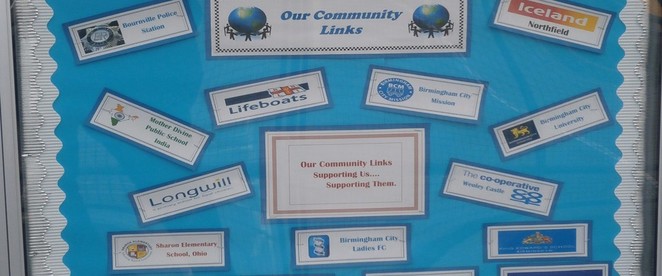
- Our Community Work
- Special Events
- Year 3
- Year 4
- Year 5
- Year 6
- Indonesia Link
- Commonwealth Games 2022
- Merritts Brook Field- info & booking


KS2 Results 2016
Want to download the information? Click Here
Links to: 
 Info for parents
![]() SATs results information from DfE
SATs results information from DfE
Key Stage 2 SATs in 2016 How well did we do?
Year 6 pupils have to take compulsory SATs (Statutory Assessment Tests) in May of each year. This report explains the outcomes of the Year6 SATs tests from May 2016.
Year 6 pupils worked extremely hard last year and have achieved excellent outcomes in their SATs (Statutory Assessment Tests), especially as the SATs in 2016 were new and much more difficult than in previous years. They also included EGPS (English Grammar, Punctuation and Spelling) tests for the first time. The tests are made up as follows:
English: 1 x 1hour reading test; 1 x 45 minute EGP test and one spelling test
Writing: teacher assessed based on evidence from a selection of writing – the school was also part of the moderation cycle this year, meaning that moderators from the Local Authority came in to check that teacher assessments were accurate.
Maths: 3 x 45 minute tests (1 arithmetic and 2 reasoning and problem solving tests)
The tests this year do not give levels as in previous years – they state whether children ‘achieved expected levels’, were below ‘expected levels’ or were ‘working at greater depth’ (higher than expected levels).
Although our results of Reading, Writing and Maths combined is lower than in previous years, this was the situation across the country – indeed, only 53% of children nationally achieved the expected levels in all three – Bellfield Junior School achieved 51%, although many children missed out by only 1 or 2 marks.
Our RaiseOnline – the information the DfE publishes to show how well our children are doing – showed that although our attainment was about average compared to National figures, our progress indicators show that children are making at least good progress – in the case of mathematics, particularly good progress. Compared to similar schools to ourselves, our figures are favourable.
We would like to say that we only achieve these results with parental and family support and we would like to say a big thank you to all of the families who support us and their children – without this being a team effort, we would not have the progress and success that our children achieve.
Our priorities for 2016/17 and beyond are to improve the attainment of EGPS and writing by adapting our curriculum and creating ‘learning journeys’. This began in Sept 2016 and we have had support from external consultants and moderators.
2016: Context of cohort: 49 children; 23 girls/ 26 boys. 28 disadvantaged (57%). 12 children (24%) SEND, inc 2 EHCP (RoL) although it was actually 3 (one child was not recorded on census at E).
4 children have no KS1 data, meaning we cannot show their progress from KS1 – this could be that that they did not take KS1 SATs for a variety of reasons. KS1 ave score: 15.2 (-0.5 national) meaning the cohort were below national expectations at the end of Year 2.
%age reaching expected standard+ (scaled 100+)
|
|
all |
boys |
girls |
|||
|
|
national |
school |
national |
school |
national |
school |
|
Rdg, wr, ma com |
53 |
51 |
49 |
42 |
57 |
59 |
|
Reading |
66 |
63 |
62 |
62 |
70 |
64 |
|
Writing (TA) |
74 |
73 |
68 |
65 |
81 |
79 |
|
Mathematics |
70 |
80 |
70 |
73 |
70 |
88 |
|
EGPS |
72 |
59 |
67 |
62 |
78 |
55 |
%age reaching a high standard or working at greater depth (scaled 110+)
|
|
all |
boys |
girls |
|||
|
|
national |
school |
national |
school |
national |
school |
|
Rdg, wr, ma com |
5 |
2 |
5 |
0 |
6 |
4 |
|
Reading |
19 |
14 |
16 |
15 |
22 |
13 |
|
Writing (TA) |
15 |
2 |
11 |
0 |
19 |
4 |
|
Mathematics |
17 |
14 |
18 |
12 |
15 |
17 |
|
EGPS |
22 |
16 |
18 |
12 |
27 |
21 |
Average scaled scores:
|
|
national |
School |
|
Reading |
102.6 |
101.9 |
|
Writing |
103.0 |
103.6 |
|
Maths |
104.0 |
101.9 |
This table shows the progress indicators:
National Average is 0, so + is above National and – is below National.
|
|
Reading |
Writing |
Mathematics |
|||
|
|
National |
School |
National |
School |
National |
School |
|
60-74% |
+0.7 - +1.7 |
-- |
+0.8 - +1.8 |
-- |
+0.6 - +1.5 |
+1.11 1 |
|
40-59& (middle 20%) |
-0.6 - +0.6 |
+0.45 2 |
-0.5 - +0.7 |
-0.53 3 |
-0.6 - +0.5 |
-- |
1 This means that our progress was above National for Mathematics at +1.11 and we were in the top 20% of Junior schools nationally
2 This means that our progress was above National for Reading at +0.45 and we were in the top 30% of Junior schools nationally
3 This means that our progress was slightly below National for writing at -0.53 but we were still in the top 50% nationally.


school website, mobile app and podcasts are created using School Jotter, a Webanywhere product. [Administer Site]
Our use of cookies
We use necessary cookies to make our site work. We'd also like to set optional analytics cookies to help us improve it. We won't set optional cookies unless you enable them. Using this tool will set a cookie on your device to remember your preferences.
For more detailed information about the cookies we use, see our Cookies page
Necessary cookies
Necessary cookies enable core functionality such as security, network management, and accessibility. You may disable these by changing your browser settings, but this may affect how the website functions.